"Detailed Report” feature for SkinSens ITS
Following the successful SkinSens ITS release during the Society of Toxicology annual meeting 2017, we received plenty of positive feedback and valuable suggestions for additional features. Below, we would like to share with you an example of such a feature that we implemented based on your feedback. Namely; the “Detailed Report”.
The aim of the Detailed Report is to support reproducibility of skin sensitization assessments based on the integrated testing strategy. It provides a single-page report that can be saved, printed or shared with regulators and which describes the whole evaluation process. It includes all input parameters, intermediate calculations as well as the output of the Bayesian network and post-processing steps, if any. Finally, the report graphically represents the different confidence in predictions and helps risk assessors transparently take a decision based on different risk scenarios.

Every build of the ITS SkinSens application has a unique version number that is shown just below the report title and allows complete reproducibility of the results. Therefore, sharing a report inherently means also documenting the exact codebase that was involved in all calculation steps.
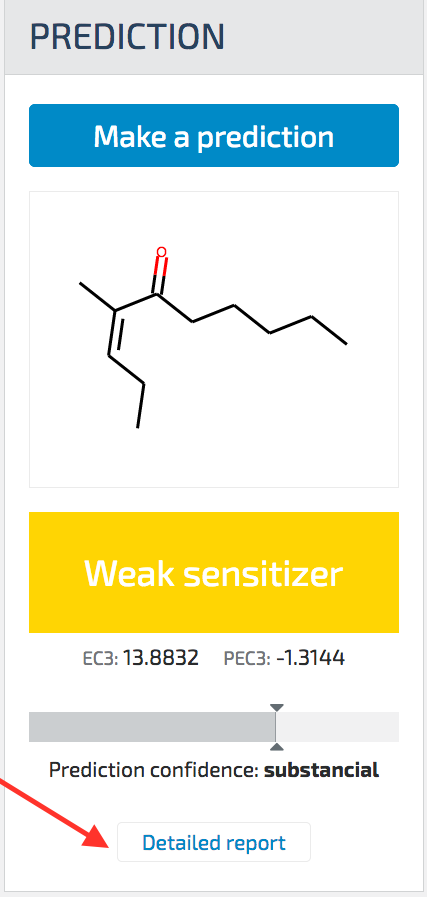
To access the report, users click on the “Detailed Report” link below the prediction results as shown in the figure.
The Detailed Report is divided into 3 sections: input parameters, calculated values and risk assessment.
1- Input parameters section documents all in silico descriptors (whether calculated or entered by the user) and experimental values used as an input to the Bayesian network.
2- Calculated values section describes the prior probabilities (either based on the network training or provided by the user), posterior probabilities, any post-processing corrections made for Michael’s acceptors, as well as the Bayesian factors calculated.
3- Safety Assessment section shows the predicted EC3 and pEC3 based on different percentiles (50%, 60%, 70%, 80% and 90%).
Graph representations of the probabilities
In the Detailed Report, risk assessors can now get different graphical representations that help them quantify the risk. Below, I am using an example from the training set (3-Decen-5-one 4-methyl- (3E)-) to explain the figures. The compound is a weak sensitizer according to the LLNA assay but predicted by TIMES to be a strong sensitizer. The ITS takes all evidence into account and the result is a "weak sensitizer" prediction However the network's confidence is only moderate (BF<30).
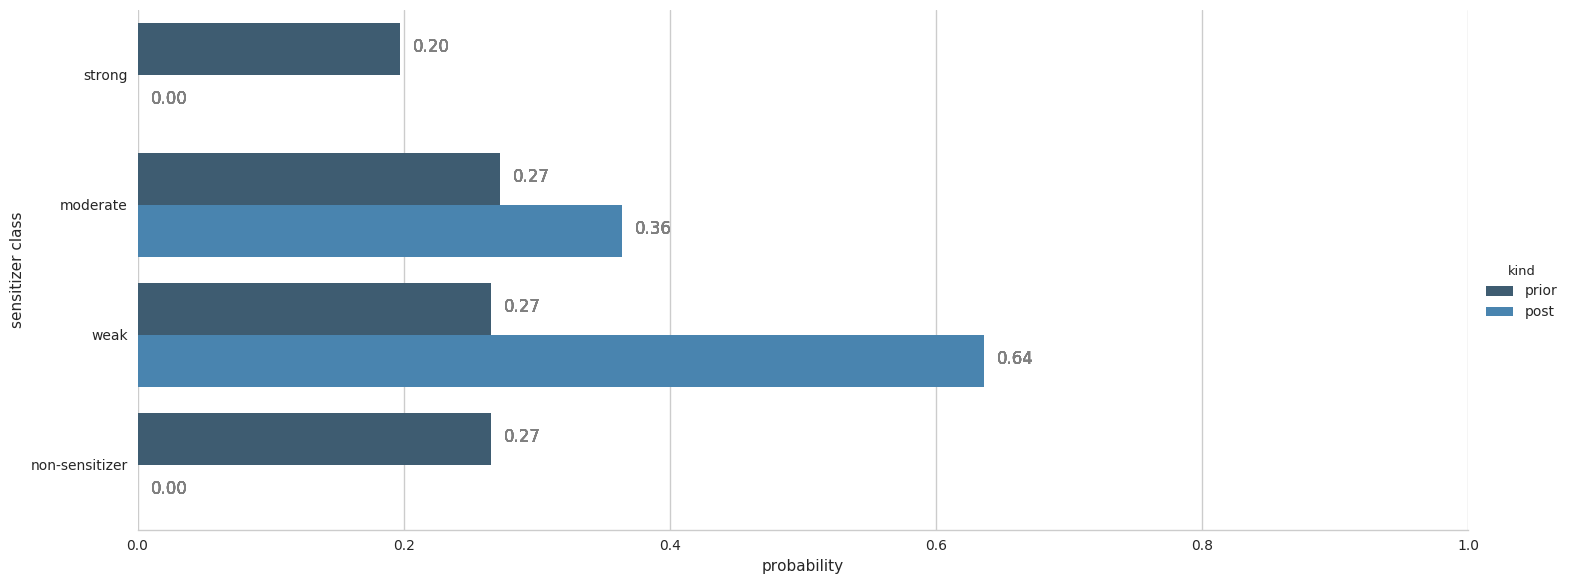
A: This figure shows the prior (dark blue) and posterior (light blue) probabilities for all 4 classes. You can see that the highest posterior probability is for the compound being weak sensitizer followed by it being a moderate sensitizer. If the compound were to be a Michael's acceptor, there would have been a third horizontal bar for the effect of the post-processing step on the posterior probabilities.
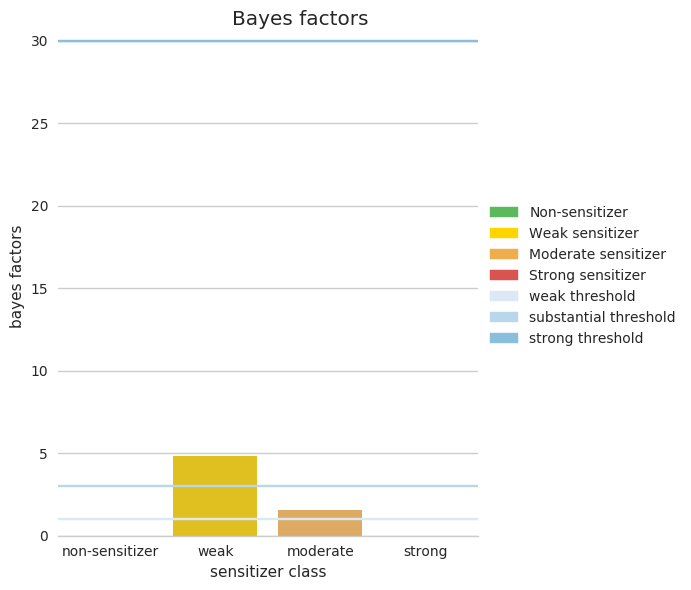
B: The second figure is showing the Bayesian factors calculated for all four classes, therefore correcting for the unbalance in the training set. Furthermore, the horizontal lines show the threshold for different confidence-in-prediction levels (e.g., BF=30 corresponding to strong evidence). Again, the substantial evidence is for the compound being weak sensitizer with a weak evidence it might be a moderate sensitizer.
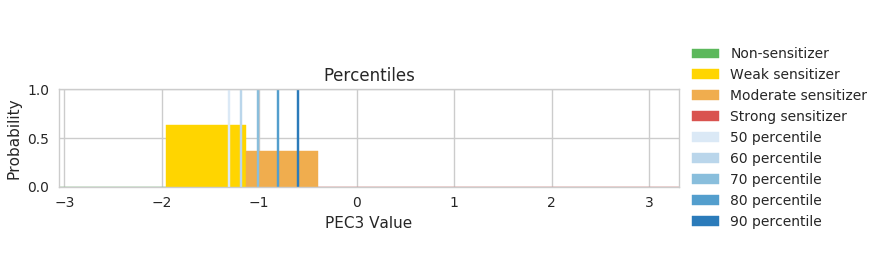
C: The third figure is for risk assessors to present different levels of confidence for decision making. The 50th percentile corresponds to the Bayesian network best guess of the outcome. Here, you can see that the 50th and 60th percentile falls into the weak category (but rather on the higher threshold) while the 80th and 90th percentiles fall under the moderate category. Risk assessors can transparently judge (according to the business case at hand, exposure, or other factors) whether they want to take the most conservative prediction (90th percentile) and consider the possibility of the molecule being a moderate sensitizer or whether it is enough to take the network's best estimate for weak sensitizer. Indeed, all the charts are also accompanies with tables that shows the corresponding EC3 and PEC3 values.
In conclusion, the ITS was able to take all evidence into account to reach a correct prediction despite the inaccurate TIMES classification. It also supports risk assessors that might prefer to calculate a worst-case scenario with the 90th percentile case.
The Detailed Report is a strong yet convenient tool that ensures reproducibility of results by documenting underlying algorithms, input parameters, intermediate calculations as well as output skin sensitization predictions. The graphical representations of probability facilitates the interpretation of numerical results in an intuitive form. While the different probability percentiles gives flexibility for decision makers to abide to different risk threshold based on the business needs.
| Dr Ahmed Abdelaziz is a Safery Scientist at Douglas Connect |